
Information graphics or infographics are graphic visual representations of information, data or knowledge intended to show information quickly and (hopefully) clearly. They can improve cognitive view by using graphics to enhance the human visual system’s ability to see patterns and trends.
Infogr.am
Infogr.am is a website which allows you to build and create your own information graphics. It gives you the options of many different styles, themes, graphs, word bubbles ect to convey your data or knowledge in the most efficient way. And it’s free!
My Infograph is link is broken
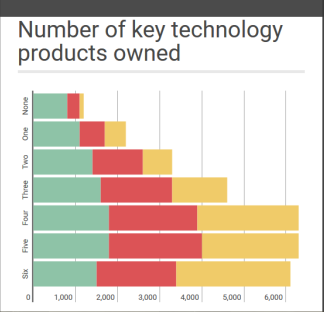
This Infographic is in relation to some research i conducted on frequent movie go-ers and how they tend to own more technology products than the general population. Nearly 3/4 of all frequent movie go-ers (74%) own at least four different types of key technology, compared to 51% of the total adult population.
